Teams | Collaboration | Customer Service | Project Management

Latest News

Why Top Companies Track Customer Experience Analytics

It’s no secret that customer experience (CX) can significantly influence your brand image, customer loyalty, and bottom line. And with customer experience analytics, you can better understand how to improve the customer experience. You’ll gain insights into the customer’s point of view, experience, and what pain points they face with your offerings. In this article, we’ll discuss the top 3 benefits of customer journey analytics and how to analyze customer experience.

More visibility and better insights with Miro App for Splunk

As Miro is used for more and more use cases across a growing number of teams and organizations, IT and security leads need better visibility into what is happening within Miro. With these users in mind, we are constantly improving the ways we empower teams to monitor user activity, identify suspicious behavior, and make data-driven decisions in real-time. That’s why we’ve chosen to partner with Splunk, the Data-to-Everything platform that helps businesses manage and protect their data.

Manage Dynamic Schemas at Scale with Rudderstack & dbt

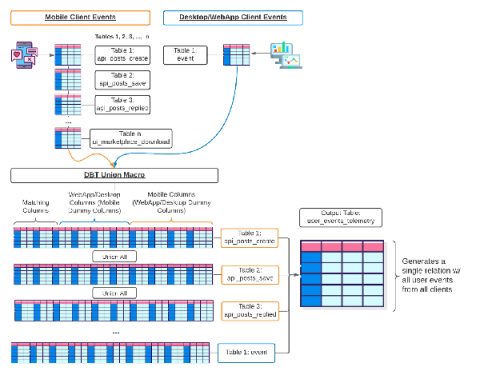
I recently had the pleasure of hosting a webinar with the team over at Rudderstack. It focused on Data Engineering and managing dynamic schemas at scale. More specifically, Rudderstack-generated, dynamic schemas at scale. This blog will discuss the tools, software, and methods to do just that.

How to Analyze Data: A Basic Guide

Data analysis is critical for all employees, no matter what department or role you work in. Whether you’re a marketer analyzing the return on investment of your latest campaign or a product manager reviewing usage data, the ability to identify and explore trends and fluctuations in your data is an essential skill for decision-making. Unfortunately, many companies today struggle with data organization and analysis.

New Features - June 2021 - Analytics

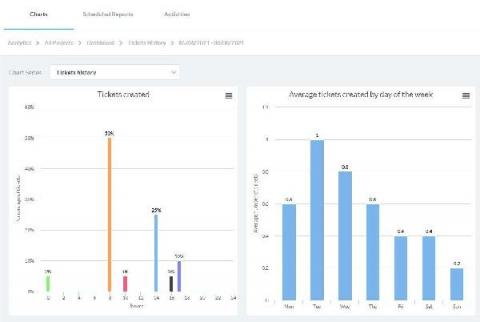
The June 2021 Release of OneDesk introduces a new App (in Beta) to centralize statistics about your tickets, tasks, and projects. We call this new app ‘Analytics’. Located under the ‘More Applications’ icon in the lower-left corner, the Analytics app brings together Reports and Activities, and introduces a new section called ‘Charts’. Here are some highlights of the new Charts app.

Introducing Universal Reporting: See all your organization's work from every angle

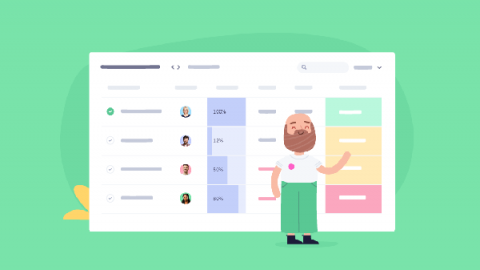
Today’s senior leaders have a visibility problem. Within your organization, you likely oversee many projects across many teams, balancing details and budgets competing for your attention. If you pause for a moment, do you know exactly the state of your organization’s work at any given time?

Your Practical Guide to Succeeding with Customer Intelligence

How much do you know about your customers? Who are they? What makes them leave and what makes them loyal? What are their biggest pain points? That means you can’t afford to guess at what makes your customers happy. You have to create experiences that take their preferences into account from the start. The way to understand who your customers are and what they want is customer intelligence.

How to Create Meaningful Productivity KPIs (Plus Free Template)

Curious about productivity KPIs? Productivity KPIs (key performance indicators) help measure how effectively your company achieves its core business objectives. And while the term may seem complex, using KPIs to measure your company’s success is pretty easy! In this article, we’ll discuss productivity KPIs, why they matter, and how to use them to improve employee performance.

Time Doctor Metrics for Hybrid Workforces

As workplaces start to reopen post-pandemic, many companies are struggling with the decision of how and where they will operate and how to set up their teams to be the most productive. A large number of companies are choosing to stay fully remote while a smaller portion are choosing to go back into the office full time.

Introducing Planned vs Actual Milestones Report to Teamwork

As we continue our focus on enhancing the reporting functionality throughout Teamwork this quarter, we’re delighted to introduce the first of three Planned vs Actual Reports — the Planned vs Actual Milestones Report. The aim of this new report is to give you an understanding of the actual status of your Milestones by comparing the original due dates with your current due or completed dates. With this view, you can quickly identify how a project is performing against your plan.