Teams | Collaboration | Customer Service | Project Management

Geckoboard

5 data-driven strategies for maximizing agent productivity in Zendesk

KPIs can be a blessing and a curse. Customer support is–in comparison to many other industries–extremely easy to measure. KPIs provide crucial insights into the customer experience and can provide a lot of direction for you. That said, an overly rigid focus on individual metrics can lead teams to chase numbers at the expense of genuine customer success. The best way to avoid that is by taking a holistic approach.

An Easier HubSpot Reporting Alternative

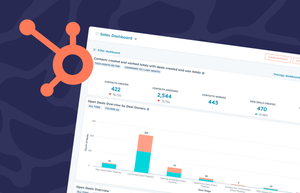
Most engaged HubSpot users will have experience using its Dashboard and Reporting Software. Here, users can build dashboards and reports that track their sales pipeline performance, as well as their sales team performance. However, there are some situations where sales leaders find that HubSpot reporting can’t deliver on all their needs. In this article, we’ll explore some alternative ways you can report on HubSpot.

How to show multiple data sources on the same sales dashboard

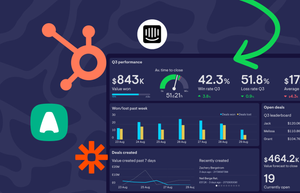
Managing sales data from different platforms can be challenging, but Geckoboard makes it easy to visualize sales metrics from tools like Aircall, HubSpot, Intercom, and Zapier all in one place. With Geckoboard, you can track these sources on the same sales dashboard or, if it works better for your team, create separate dashboards that focus on specific areas. This flexibility allows you to monitor exactly what you need, whether you prefer a unified view or detailed insights across multiple boards.

Guide to reporting on your HubSpot sales pipeline

Managing a sales pipeline can feel overwhelming without the right insights. Deals are progressing, but without clear data, it’s tough to know what’s working and what’s holding things up. That’s where HubSpot’s sales pipeline reporting comes in. It gives you visibility into every stage of your pipeline, helping you catch issues early and keep your team focused on the most important tasks.

7 HubSpot reporting tips every sales manager should know

As a sales manager, your ability to track performance, identify trends, and make data-driven decisions can directly impact your team’s results. You’ve probably already discovered that HubSpot offers a wide range of reporting tools to help you monitor sales activities, assess team performance, and analyze key metrics. But while these tools are powerful, using them effectively requires more than just pulling standard reports.

9 important HubSpot sales metrics to track

When it comes to sales, numbers tell the real story. But with so many metrics out there, it’s easy to get lost in the data. That’s where HubSpot comes in; it offers a ton of ways to track your sales performance, but knowing which numbers actually matter can make all the difference. Focusing on the right HubSpot sales metrics gives you a clear path to better decisions, smarter strategies, and more wins.

Complete guide to HubSpot dashboards for sales

Sales managers often face the challenge of tracking key performance metrics and keeping their teams aligned with sales goals. HubSpot dashboards are a powerful tool to help streamline this process, making the sales pipeline more visible to everyone that needs to see it. Whether you’re new to HubSpot or you’re just looking for a few tips, understanding how dashboards work can transform the way you manage sales performance.

Setting up your HubSpot pipeline for better reporting

Getting your sales pipeline right in HubSpot isn’t just about staying organized; it’s about making sure your data is clear, actionable, and reliable. Without a well-structured pipeline, your reports can become skewed, leading to inaccurate forecasts and missed opportunities for your business. A well-built pipeline helps you to make sure that every deal is tracked properly, giving you a true picture of what’s happening in your sales process.