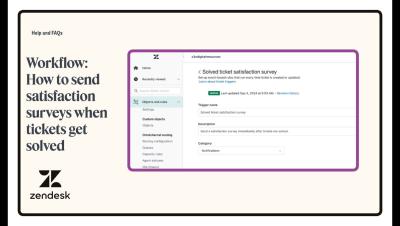
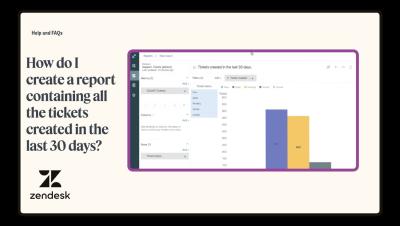
This episode features an interview with Kosheno Moore, Vice President and Digital Community Leader for Regional Center Satellite at Fidelity Investments. In this episode, Shawn and Kosheno discuss strategies for creating meaningful digital connections, the future of D&I within corporate culture, and how to foster a sense of belonging among employees.
In this dashboard tutorial video, we will walk you through building a Network Performance dashboard. This dashboard provides users with the visibility they need into the status of their network performance from their offices down to an individual users device. Obtaining this single pane of glass visibility is made easy with the combination of both CloudReady and Service Watch metrics into dashboards. When utilizing these dashboards, users can quickly identify which networks are performing poorly, allowing them to quickly resolve issues and ensure end users have an optimal experience.
In this dashboard tutorial video, we will walk you through building a Teams Health Dashboard by combining the collected metrics for CloudReady Synthetics and Service Watch Desktop. The Teams Health Dashboard provides users with a holistic view of Microsoft Teams availability and performance. When an issue occurs, users can quickly review the Teams Health Dashboard and identify whether the issue is limited to an office or affecting Microsoft Teams as a whole.
In this dashboard tutorial video, we’ll be walking you through building a Microsoft Exchange and Outlook dashboard utilizing CloudReady Synthetics and Service Watch Desktop. This dashboard is a great first stop when diagnosing user email issues. When an issue comes up, engineers can quickly review the CloudReady data available in the dashboard to identify if an office or Exchange Online is experiencing issues or an outage.
4 key tips to maximize Zendesk value | Zendesk for Startups Qualifying startups can use Zendesk free for six months. Startups can kickstart and optimize their Zendesk experience to see value in our platform right away in four key steps.
On June 27, we hosted our highly anticipated second event in our Post-Relate Community series, where we delved into the world of AI agents: the most autonomous bots in CX. Our expert panel provided a deep dive into the core functionalities of AI agents, followed by an engaging, interactive demo.
In this dashboard tutorial video, we will walk you through building an Actionable Alarms dashboard. This dashboard provides users with the visibility they need into the status of their SaaS solutions as well as how their end-user devices are performing. Dashboards allow combining both CloudReady and Service Watch data into a single pane of glass for visibility. Utilizing the Alarm widgets, users can quickly identify what issues need to be investigated while quickly being able to access the affected resources for review.