Teams | Collaboration | Customer Service | Project Management
January 2024
How to display Google Sheets data on a TV screen
The 9 Top Ecommerce Analytics Tools for 2024
7 Best Slack Apps for Sales Team Productivity in 2024
How to Automate Reporting (Without Using a BI Tool)
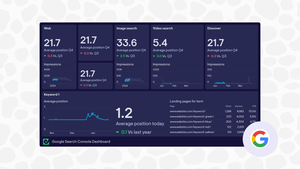
How to make a Google Search Console dashboard to monitor search KPIs
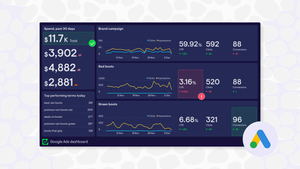
How to build a streamlined Google Ads dashboard with Geckoboard
What is a KPI dashboard? | No-nonsense guide with examples
Most business folks have (at least) a vague understanding of what a KPI dashboard is. But when it comes to creating your own – it’s not always so easy to know where to start. All of a sudden, what you thought was a simple business practice presents lots of questions, which you don’t necessarily have answers to. How do I know what metrics to include? How do I design my dashboard? What tools and software will I use to build my KPI dashboard? How will I manage my data?
4 Most Popular Ways to Create a KPI dashboard
KPI dashboards are an essential tool for any business leader who wants to monitor how their business is performing, and stay on top of real time data. There are many ways to create a KPI dashboard. We go into further detail on how to approach choosing the right KPI dashboard software in our 2024 Dashboard Buyer’s Guide. In this article, we explore the four most common methods businesses use to create KPI dashboards. They include.
How to Create a KPI Dashboard? | 4 Common Methods
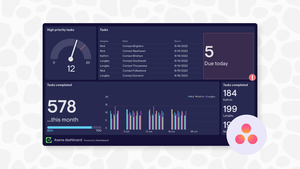
How to build a custom Asana dashboard with Geckoboard
Asana is one of the most comprehensive project management tools out there, with a wide range of features that help teams organize their work. It even has reporting dashboards baked in, allowing you to easily create dashboards for your Asana projects in a few clicks, extract insights from your data, and drill in to the specific tasks from a data visualization.
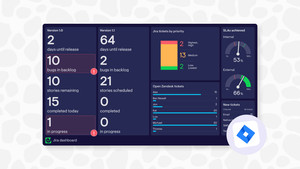
How to Create a Custom Jira Dashboard with Geckoboard
If you’re using Jira day-in, day-out, it’s probably fair to say you’re one of those people who loves getting stuff done. For staying organized, capturing details around individual tasks, and managing projects, Jira is great. But it's all too easy to get lost in the details of our boards, and miss the big picture of what’s happening in a project.
A History of Customer Support Technology
There are more ways than ever for customers to get in touch with tech support. Ever wonder what customer service looked like 50 or 60 years ago? It certainly wasn’t as accessible or intuitive as it is today. Here’s a look back at how customer support technologies evolved over the last century, and a peak at where they’re going next.
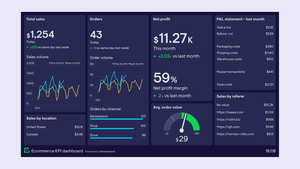
How to report on multiple Shopify stores using one dashboard
Shopify users are an entrepreneurial bunch – so it’s not surprising many of them manage more than one Shopify store. Whether you own multiple businesses, have multiple store locations, or just manage multiple brands under the same umbrella, it’s common to set up these ecommerce sites as seperate stores on Shopify.
9 Best Shopify Dashboard & Reporting Apps of 2024
Shopify store owners who are business-savvy know how important it is to stay on top of key metrics and reporting. Although Shopify offers its own in-app analytics package – Shopify Analytics, it can be limited by some of its features. That’s why many Shopify users incorporate 3rd party apps to help with their Shopify reporting, and reduce the amount of friction involved in tracking their online store’s performance.
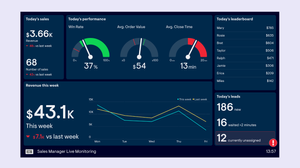
7 best sales dashboard software & tools to use in 2024
The best sales leaders know how important it is to stay on top of metrics and sales KPIs. In fact, McKinsey research from 2022 showed how taking a robust, data-driven approach to B2B sales can increase sales growth as much as 25%. Choosing the right sales dashboard software is not always easy, with many different tools on the market which are better (and worse) for different business types.
7 Best KPI dashboard tools for businesses in 2024
In the fast-paced business world of 2024, keeping a close eye on your company's Key Performance Indicators (KPIs) is more important than ever. That's where KPI dashboard tools come in. It’s not just about tracking numbers for the sake of it. It’s about building a data-driven culture, where everyone in the team knows how they are performing against strategic goals. Where team members can spot important changes to key metrics and react fast.


