Teams | Collaboration | Customer Service | Project Management
Dashboards
How to set SMART goals
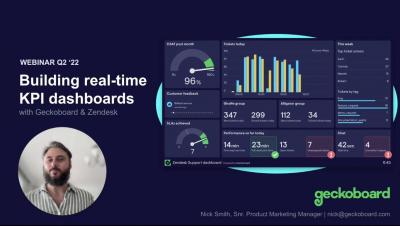
Webinar: Build real-time dashboards using Geckoboard & Zendesk ~ June '22
SMART ASSES - a way to set even smarter goals
If you’ve ever had to set a goal, it’s likely you’ve come across the SMART framework.* A SMART Goal is a goal that is Specific, Measurable, Assignable, Realistic, and Time-related.
Dashboard | Award winning Employee Monitoring Software | We360.ai
OneDesk - Creating and Using Custom Chart Dashboards
How to measure sales productivity through the success of sales calls
From booking rep appointments to even boosting your ecommerce conversion rate, sales calls can massively impact the success of your business, which is why it’s so important to know how to measure sales productivity by the success of your calls. When the discussion of sales calls comes up, many people instantly think of cold calling (phoning prospective customers before they express any kind of interest in your product or service).
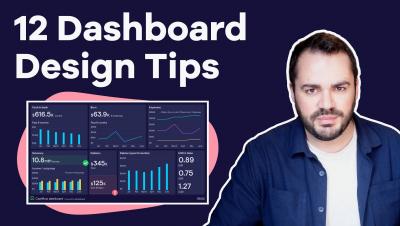
12 Dashboard design tips for better data visualization
Example KPI Dashboards
KPIs or Key Performance Indicators, are measurements that determine how well your organization is meeting its goals and objectives. KPIs are crucial to making data-driven decisions for your business. KPI dashboards provide a single screen of useful charts and graphs to easily measure your progress and performance. As such, when determining what KPI charts to use, consider your industry focus, project planning methodology, and business goals.
Custom Analytics Dashboards for Specific Industries
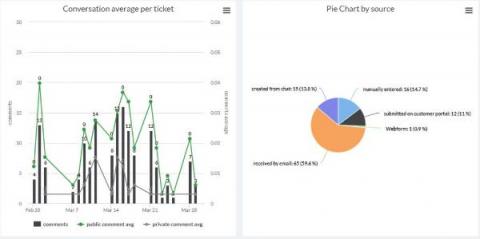
The analytics dashboard in OneDesk can be used to quickly view performance indicators and relevant charts for your organization. This dashboard can be configured to easily show the charts and date ranges which are most relevant to you and your business.


