Teams | Collaboration | Customer Service | Project Management

Dashboards

Why we need a better way to share live data with clients

For agencies, consultancies, and even freelancers – getting your reporting right is crucial. How well you report back to your client can make or break your relationship. That’s because the reporting process goes well beyond: “did we do well this month?” It’s about demonstrating how your performance contributes to your client’s overall strategy.

A guide to managing agent seats in Zendesk

At Geckoboard, we work with many Zendesk customers around the world. One of the great things about Zendesk is that it offers a variety of pricing plans to suit different budgets and levels of usage. A key consideration when budgeting for a Zendesk Suite plan is allocating the number of agent seats (paid user licenses) for team members you add to your account. You can choose to start with a few seats and then increase your seat count as your team grows.

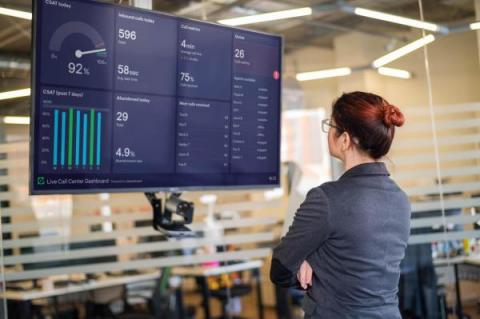
How to create a TV dashboard for Zendesk

When it comes to connecting with customers, Zendesk is a fantastic solution. From Sales teams to Customer Support, over 100,000 businesses rely on Zendesk to create seamless customer experiences. With Zendesk being such a fundamental part of many businesses' data stack, it’s not surprising that many wish to visualize their Zendesk metrics on a live TV dashboard. In this article, we’ll take you through our step-by-step guide to setting up a TV dashboard for Zendesk.

What is a data visualization dashboard?

A data visualization dashboard provides decision makers with a high-level view of their most important metrics. It combines numbers, charts, graphs, and other graphics designed to focus an audience on the metrics that matter. They can be helpful for spotting problems early, making decisions about where to allocate resources, and measuring progress over time.

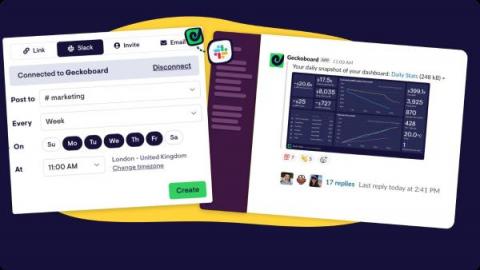
4 ways to generate Google Analytics reports in Slack

For the companies that use it, Slack is the business equivalent of mission control. The collaboration hub that connects everyone’s work – wherever they are. Much more than a messaging platform, the secret to Slack’s success is how easily it integrates with the tools businesses use every day. From popular collaboration tools like Google Docs, to automated alerts and notifications for thousands of niche and specialist products.

How to create a Google Analytics TV dashboard for GA4

Statistically, if you own or manage a website, you’re probably using Google Analytics. For countless business owners and marketers, Google Analytics is their go-to source for website performance data. Google’s dominance in the analytics world looks set to continue, even as it currently migrates its 35 million customers onto Google Analytics 4 (otherwise known as GA4 – the new version of its product) by July 1 2023.