Teams | Collaboration | Customer Service | Project Management
Geckoboard
3 Dashboard tips to track Google Analytics 4 (GA4) data
As you likely will have heard by now, Google's old Universal Analytics will finally stop processing data on July 1 2023, with the newer Google Analytics 4 (GA4) taking up the mantle. And although most businesses use Google Analytics, most businesses don’t have a dedicated analytics specialist.
Don't Panic! Zendesk metrics at your fingertips
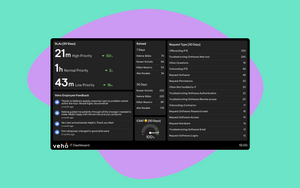
Veho's Help Desk use Geckoboard & now have complete oversight of their workload
Josh Hus, IT Services Manager at Veho, tells us how their internal Help Desk use Geckoboard to track workload as well as to spot ongoing issues that might need addressing.
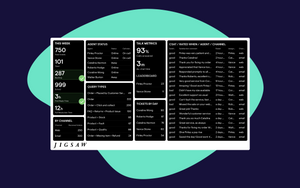
How dashboards helped transform the way the Jigsaw Customer Service team operate
We talk with James (Customer Experience Manager) and Tania (Deputy Customer Experience Manager) from Jigsaw about how implementing dashboards has transformed their agents' relationship with data.
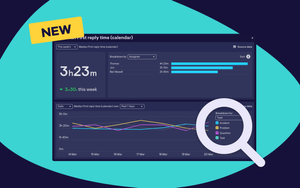
5 examples of Geckoboard's Interactive View in action
Recently we shipped a new Interactive View - currently in beta - that makes it much quicker to investigate interesting changes to your metrics in Geckoboard, without jumping into more complicated tools. It’s currently available on Zendesk Support, Intercom, Facebook Ads, Google Analytics 4, Google Search Console, Shopify and Stripe widgets, on all plans.
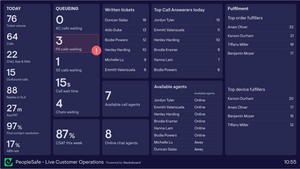
The Customer Ops dashboard that motivates agents and saves valuable time for PeopleSafe
Mo Elsopki, Head of Customer Experience at PeopleSafe tells us how their live Customer Operations dashboard builds friendly competition among agents as well as deflecting ‘internal tickets’ from other departments to help them stay focused on providing great support.
How Aalborg Håndbold use dashboards to positively impact the whole Pro handball club
Martin Stigaard Skammelsen, Head of Marketing and Matchday Experience at Aalborg Håndbold, tells us how he took a whiteboard of daily metrics into a live dashboard that aligns multiple teams around goals that positively impact the whole handball club.


