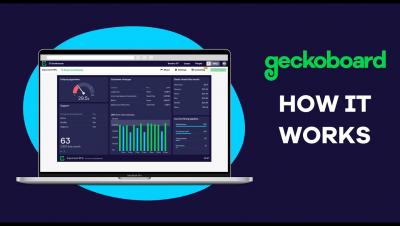
Continuing our series of Geckoboard customer interviews focused on KPIs, goal setting frameworks and dashboards, we speak to Matt Bryant, Customer Service Manager for COBB Tuning. Matt tells us how COBB Tuning maintains a consistently high CSAT score with a large volume of tickets and how their dashboards have kept the team pulling in the right direction throughout the Covid crisis.
In 2007, toothpaste company Colgate ran an ad stating that 80% of dentists recommend their product. Based on the promotion, many shoppers assumed Colgate was the best choice for their dental health. But this wasn’t necessarily true. In reality, this is a famous example of misleading statistics. The ad suggested that dentists preferred Colgate over other toothpaste brands. But the survey asked them to list several brands of toothpaste they would recommend.
You spent the whole quarter collecting data about your new website design. You tracked a ton of KPIs, from traffic fluctuations to bounce rates. It's time to show your manager the success of your redesign. How do you do that? With KPI reports. A great KPI report doesn’t just showcase the data you collected; it also presents an argument for the next steps your organization should take.
Continuing our series of Geckoboard customer interviews focused on KPIs, goal setting frameworks and dashboards, we speak to Sandeep Jindal, Head of Customer Support at Furlenco. In this post we cover how India’s largest online furniture rental company uses Geckoboard dashboards to monitor their most important Customer Support metrics, what they did to increase CSAT from 75% to 85%, how they’ve been impacted by Covid and much more.
When you’re responsible for a team’s performance, you might feel the itch to micromanage. You might be thinking, if you don’t watch employees’ every move and assign all tasks, how will the group stay on track? But micromanaging stifles the creativity and collaboration that drives high performance teams. Multiple studies have shown that micromanaged employees are less creative, produce lower-quality work, and are less engaged overall.
In the first in a series of Geckoboard customer interviews focused on KPIs, goal setting frameworks and dashboards, we speak to Michelle Jaeger (Operations) from Five Doors Network. We’ll cover how Five Doors uses the Keller Williams Four Conversations method to build a highly successful real estate team and how their dashboards allow them to monitor their most important metrics.
Think of a set of data visualizations like the dashboard in your car. When you look at them, it should be easy-to-absorb information at a glance—your speed, fuel amount, and so on. Likewise, data visualization techniques help your teammates and managers grasp the significance of the metrics in seconds. Speed isn’t the only advantage of data visualizations. A report found that people were, on average, 89% better at problem-solving when they looked at data represented visually.