

We are all moving towards a digital workplace – or a hybrid work scenario.
Currently, 1 in 4 Americans are working from home. By 2025, 36M American workers will be working remotely, an increase of 87% before the pandemic.
Whatever be the case, you can expect end-users to call and complain about a poor WiFi experience. That’s because network monitoring needs to be done from their standpoint, not from the enterprise end.
And without the correct WiFi observability data, it’s challenging to narrow down the root cause of the problem affecting remote employees. And those problems – poor WiFi performance leading to poor digital experience – can be pervasive and persistent.
Let’s Play a Blame Game
Effectively finding and solving a WiFi problem requires a lot of data. But very often, IT staff members will start pointing fingers at Internet service providers to shift the blame.
Traditional monitoring tools have poor visibility into what’s causing problems with smooth WiFi delivery. In addition, these tools are reactive with no insight into what a user is seeing or experiencing.
The result is that application teams will point to network teams which, in turn, would blame to the end-user computing team. And network engineers and IT still don’t have answers to —
- Is the issue restricted to an application? Or
- Is it the endpoint device and health problem? Or
- Is it the home network problem affecting the signal?
How About We Correlate the Data
The challenge for IT is correlating time-aligned and contextual data from multiple vantage points to identify the root cause. For network engineers, WiFi troubleshooting can get complex. For example, there are multiple access points, different browsers, signal quality issues, frequency bands, gateway errors, BYOD policies, bandwidth capabilities, etc.
By proactively monitoring wireless performance from endpoint devices, valuable metrics can be collected and issues reported before users complain. These metrics aid in quick decision-making for optimizing the network and, finally, improving the end-user digital experience.
WiFi Observability and Coverage with Exoprise
Fortunately, you can access Digital Experience Monitoring (DEM) solutions like Exoprise to uncover performance problems with WiFi and endpoint devices.
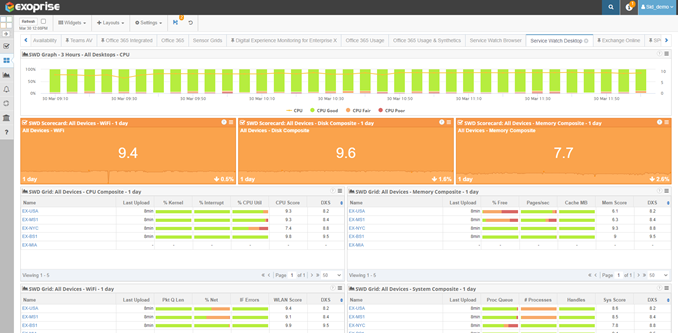
After you sign up for Exoprise Service Watch Desktop (our endpoint monitoring solution), deploy agents to all remote devices. You should see a high-level overview of device health and performance from every location.
Start with analyzing whether the issue is with a single user or multiple people in the organization. The Service Watch dashboard below indicates that the WiFi score for all devices is 9.4.
That’s it. You don’t need to make any assumptions. Only one person has to experience difficulty with their WiFi connection before you realize the benefit of capturing the data and pinpointing the WiFi networking problems. Technology teams can look at a network or common application problem for resolution for a larger audience.
Leverage WiFi Composite and Experience Metrics
Let’s say we identified a user “SWD: EX-USA” who reported an issue with their signal. From the grid shown above, click on the user and navigate to the details page.
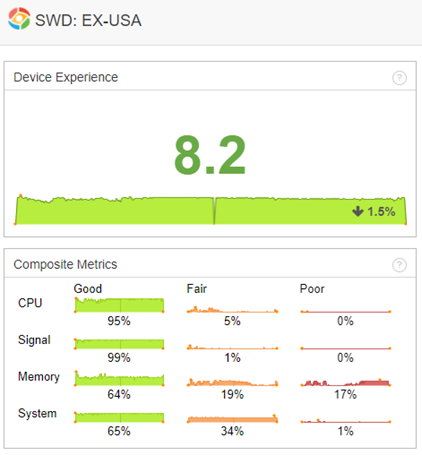
You come across the device experience score and composite metrics for CPU, Signal, Memory, and System on the details page.
The Signal Composite is an aggregate of WiFi signal measurements sampled every 30 seconds from endpoint machines when actively utilizing the device. This composite metric includes measures of WiFi signal strength, link quality, and the round-trip time to the gateway for the WiFi connection.
A low composite score indicates poor signal strength or quality and difficulty ensuring a good Internet experience with SaaS and Desktop applications.
But let’s look at some other conditions objectively
- What are the trends with the Signal Composite metric?
- Is it reasonably consistent over different time intervals?
- Are there periods when the signal is weak or better?
- How often does the user experience a poor WiFi experience?
IT can find clues to these questions below with real-time insights.
Drill Down into Low-Level WiFi Observability Metrics
Several points within the WLAN infrastructure can help further to diagnose WiFi digital experience issues with a remote worker “SWD: EX-USA.”
Exoprise categorizes low-level WiFi diagnostic metrics into two different categories:
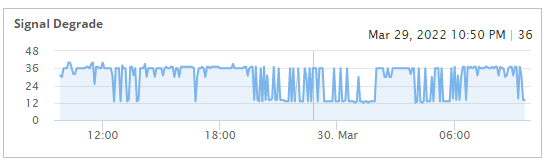
1) WiFi Signal
- Signal Degrade – This is the inverse of signal strength. The lower the degradation, the better the connectivity with WiFi.
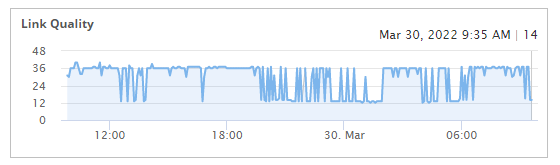
- Link Quality – The wireless LAN interface driver reports this metric. The overall quality of the wireless connection is essential for smoother collaboration and online business meetings. The higher the number, the better. A value of 100 implies the highest signal quality.
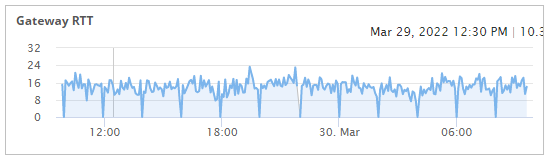
- Gateway RTT – Round-trip time, also known as latency, is measured in milliseconds of response to a gateway or next hop for the wireless interface. Gateway RTT is a critical measurement for the health of the WiFi connection and is measured every 30 seconds. If you have slow RTT to the gateway then every connection to every network (or Internet) resource will be slow.
2) WiFi Utilization
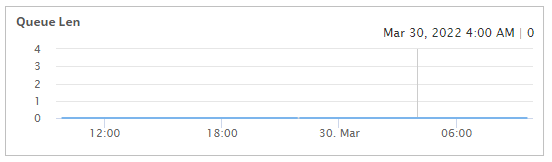
- Queue Len – If the output queue length exceeds two, it indicates packet loss and delays in receiving data. Ideally, the number should be zero.
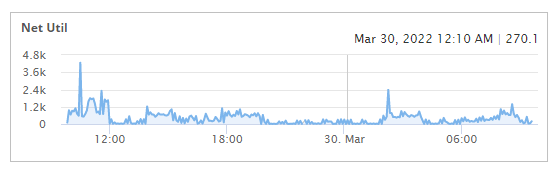
- Net Util – This metric measures how much traffic is being send and received through your wireless interfaces. Under ideal conditions, 2.4 GHz WiFi will support up to 450 Mbps or 600 Mbps, while 5 GHz Wi-Fi will support up to 1300 Mbps. Typically, anything under 30kbps sustained will represent low network utilization and not impact network applications.
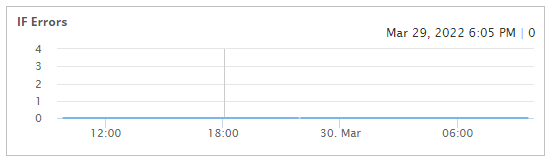
- IF Errors – IF (Interface) errors are measured in packets. These include packet outbound errors, packets received errors, packet discards errors, etc in the wireless network. This number should be zero unless there are problems with the local LAN.
And Here’s Your WiFi Connection Analysis
Our initial analysis suggests that the user “SWD: EX-USA” is experiencing signal strength and quality issues. , meaning weak access points or poor home networking.
Additionally, the gateway latency of 16 ms is slightly high for the next hop to get to the Internet if you are utilizing lots of network applications. Ideally, you would like gateway RTT on a WiFi network to be less than 10ms.
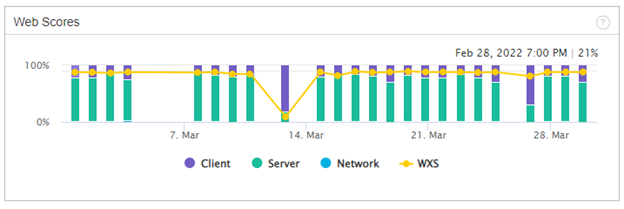
While the end-user is experiencing signal degradation issues, the web experience score (WXS) is also worth checking. WXS will suffer due to poor Wi-Fi strength, and page load time will increase.
All the utilization metrics look good with no errors or packet loss. Furthermore, network utilization is low when the user is on WiFi.
Next Steps to Improve the WiFi Experience
Rather than shifting the blame, you have now located the signal issue and found where the problem is for the end-user.
Consider resolving the issue with the following measures
- Work closer to the router or connect with a cable
- Upgrade your Internet speed
- Add extra access points to amplify coverage
- Choose a higher frequency band of 5 GHz for a higher speed
In addition to the above measures, you can check for
- Local ISP outage and alerts
- Access point power reset
- Power outages
- Disturbance and interference from other devices
- Cables and power connections
Promote a Work from Anywhere WiFi Culture
Your end-users always need continuous connectivity and quality, no matter where they are.
Proactively monitor and measure wifi traffic on endpoint devices. Gain insights into individual networks to significantly impact WLAN performance.
Exoprise DEM provides IT departments and network teams with a complete picture of users’ experience with WiFi observability.
Request a demo today and see for yourself.