
Service Watch and Desktop Virtualization

This article covers the benefits and instructions for deploying Service Watch Desktop for end-user devices and Desktop Virtualization platforms such as Azure Virtual Desktop, Windows 365, or Amazon Workspaces. The use of Virtual Desktop Infrastructure (VDI) is on the rise because of remote work, and increased need for security, and outsourcing.
The rise of these environments brings the need to proactively monitor and troubleshoot remote virtual desktops – there are lots more moving parts, for sure. Whether problems occur on the end user devices, across the Internet or within the virtual machine itself, running Service Watch will get you the ultimate visibility into VDI and endpoint issues.
Deploy Service Watch for Real-Time Remote Desktop Client Network Metrics
First deployed to the end user’s device, Service Watch will begin collecting resource utilization, reliability data, application metrics, and (most importantly) network path telemetry. Service Watch captures latency, jitter, packet-loss for all the remote networking clients such as the new Remote Desktop Client; msrdcw, msrdc, and mstsc executables. If users report performance issues, hop-by-hop network ASN and router information is continually recorded (every 15 seconds) for diagnosis and troubleshooting across the virtual infrastructure and into the service provider’s network.
You can find more information on the data being collected by Service Watch in the Service Watch Desktop Overview https://help.exoprise.com/kb/service-watch-desktop-overview/
Connected and Streamed Networking
When a user remotely accesses their virtual desktop, they will be connecting to the virtual machine via the Remote Desktop Client, Remote Desktop Protocol (RDP) or a browser. Service Watch automatically detects remote sessions and begins analyzing the network path every 5 seconds. Whether a TCP/IP or UDP session, RDP supports both TCPIP connected and UDP streaming protocols, Service Watch will probe the network path performance to identity the slowest node, ISP and network segments. This network performance information is available for real-time troubleshooting of Azure Virtual Desktop connections or long-term trending to identify the slowest Internet Service Provider segment.
With the resource, application, and reliability information collected, you can quickly identify if the users’ experience is being impacted because of the machine itself or if the problem is somewhere in the network path between the RDP client and the cloud pc or VDI environment. You’ll know whether the bottleneck is in the local LAN, gateway, ISP, Internet, or provider network like Microsoft Azure. Once pinpointed, you can share the captured data with network administrators or other support personnel.
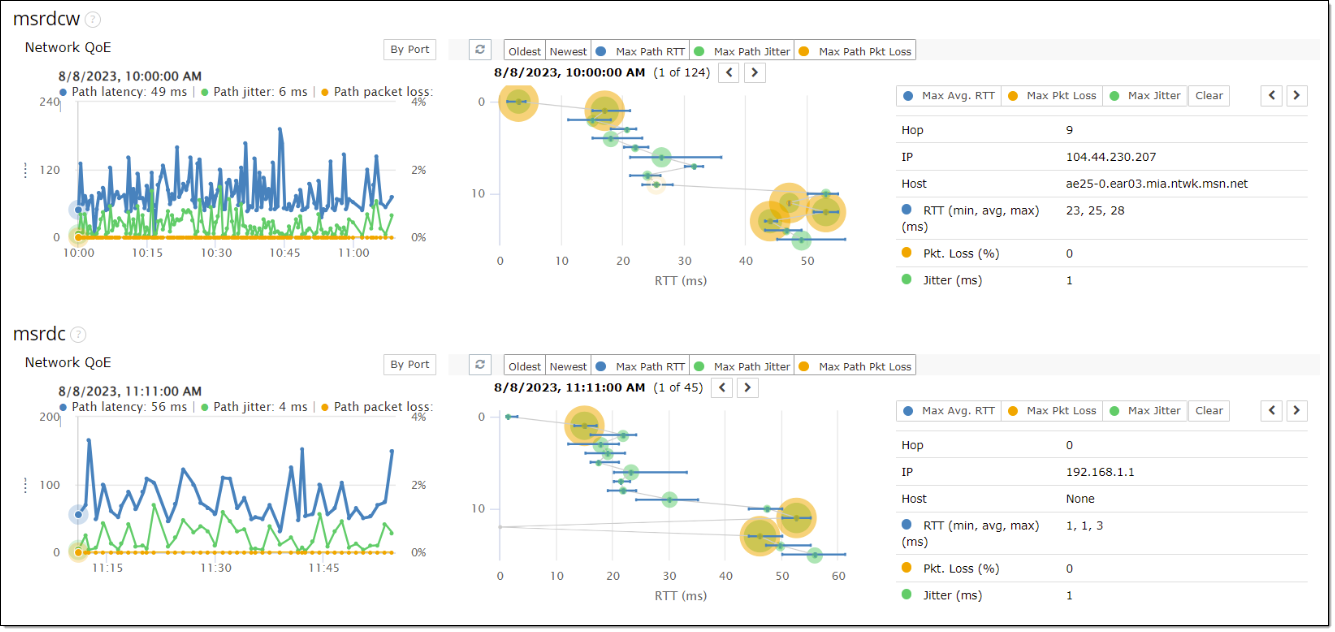
The graph on the left represents the latency, jitter and packet loss experienced by the client. By clicking an entry, the middle graph will populate. The middle graph represents a hop-by-hop network diagram, showing you the routes that the traffic took to reach the virtual desktop infrastructure. The rightmost chart provides drill-down details for each node within the network path. These metrics help you pinpoint the exact network router or ASN where slowdowns occurred and which Internet Service Provider is responsible. The buttons at the top provide a quick focus on the offending node for any conditions. Usually, for TCP/IP connected remote desktop sessions, the node with the most latency is the culprit.
When an end-user contacts the helpdesk, every metric is recorded and available for diagnostics. Quickly navigate to the real-time VDI latency from the user’s device to Azure Virtual Desktop or Windows 365.
Service Watch From Inside a Virtual Desktop Machine
What if the issue isn’t with the end user’s device but instead, the virtual desktop (VM) itself is performing poorly? By deploying Service Watch within the virtual desktop, the same detailed and rich telemetry can be captured for troubleshooting issues.
Reliability Data
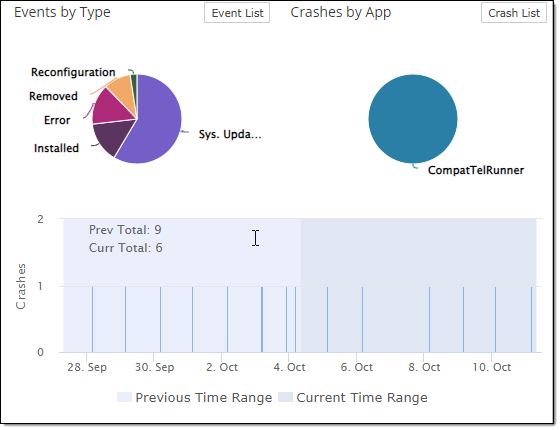
Once you pull up the device in Exoprise, you can verify that there are no applications crashing or critical events affecting the virtual machine in the Event List and Crash List at the top right.
Network Performance
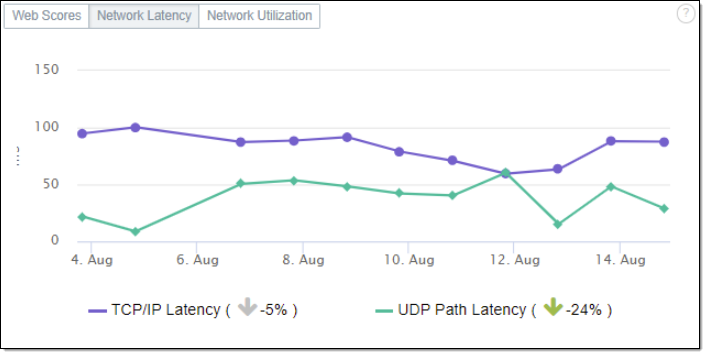
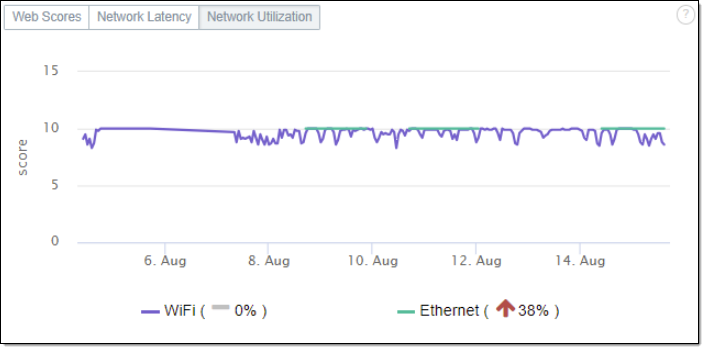
The Network Latency and Utilization are great for a quick glance to ensure there are no connectivity problems or bandwidth issues in the cloud infrastructure hosting the virtual desktops. If application access is secured via remote desktops and VDI, measuring latency and response times within the virtual machine is critical to ensuring a good digital experience.
Application Resource Utilization
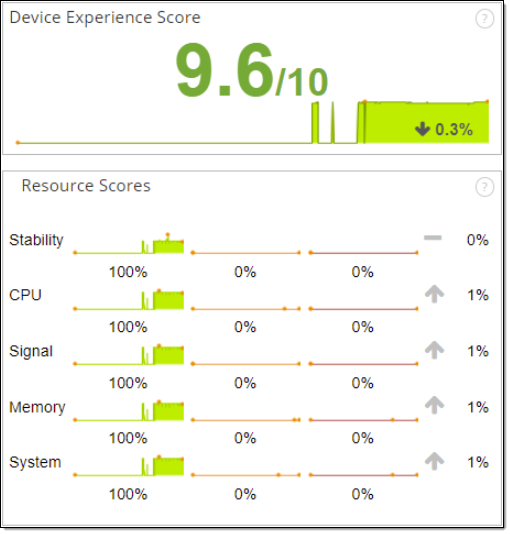
You can also ensure the virtual machine isn’t running out of resources with the Device Experience Score and Resource Scores on the left-hand side.
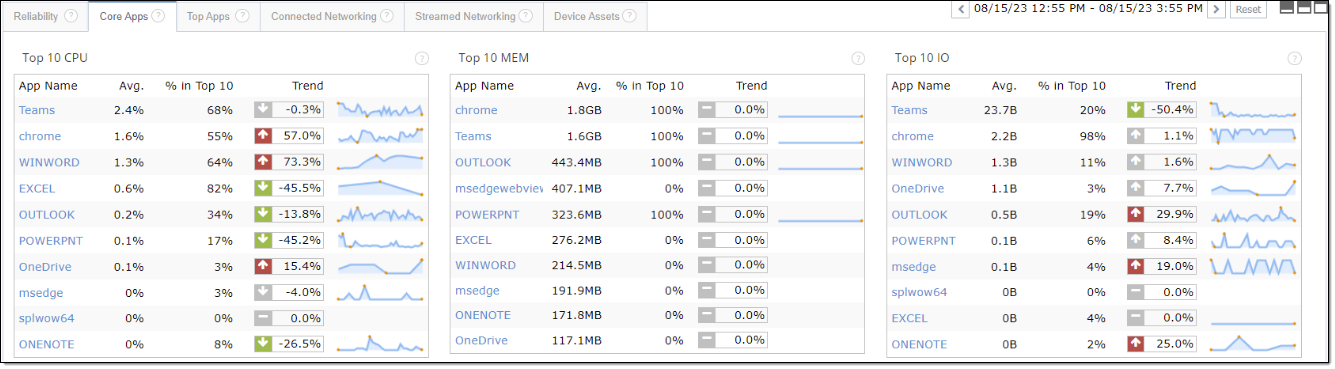
If only a specific application is performing poorly, you can drill into the Core and Top applications to see which resources the application is over utilizing.
Then take it one step further by clicking into the application itself.
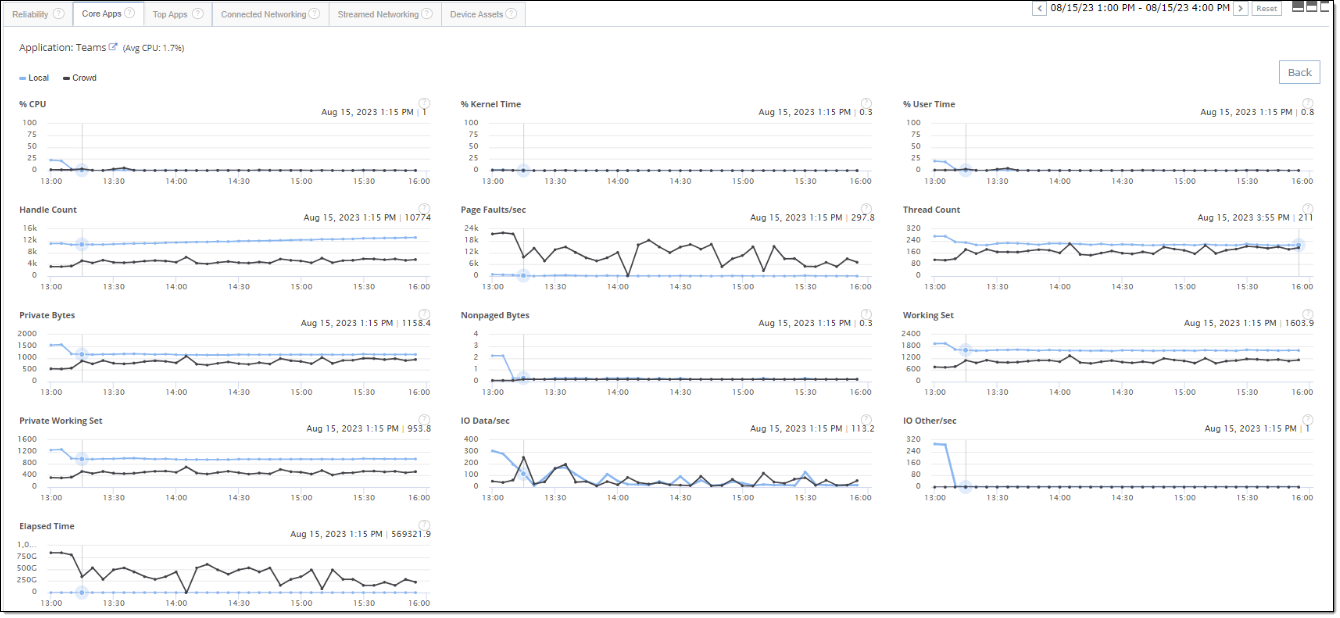
Always remember to compare what you are seeing to the crowd also, the crowd is an aggregate of the other Service Watch Desktop devices in your tenant. This allows you to quickly identify if only this virtual machine is experiencing the issue, or others are as well.
Connected and Streamed Networking
Microsoft limits the ICMP network telemetry from Azure Virtual Desktops and Windows 365 to internal Azure resources (talk to Microsoft, don’t blame us). Service Watch Desktop can populate connection information for other non-Microsoft core applications and SaaS, VPN, or internal applications that are delivered via virtual desktops. You will get richer network path telemetry if you work to enable ICMP for Microsoft Azure and allowed through the virtual network and firewall, as well as requires routing tables and for the virtual machine to have a public IP.
Service Watch Active Test for Proactive Detection
Even with the limitations in the Microsoft infrastructure, Exoprise can still actively test and monitor VoIP performance via our network sensors, including Azure VoIP sensor.
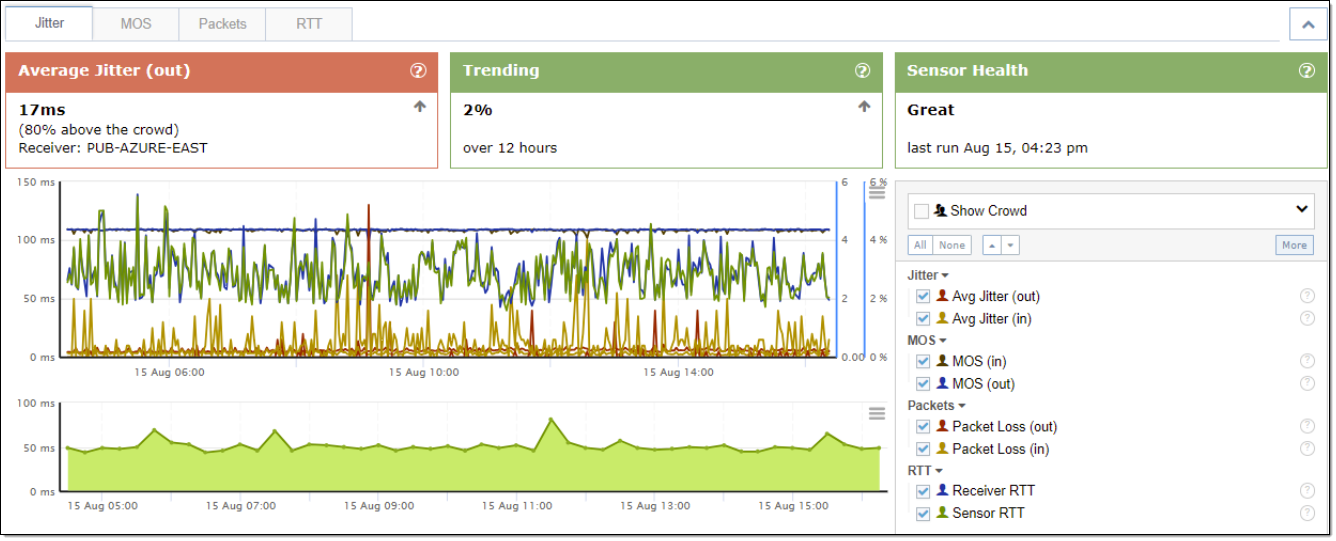
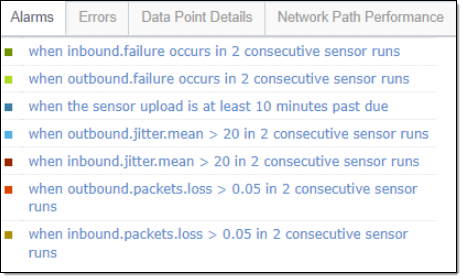
These low-level sensors are configured out of the box to alarm on issues such as poor response times, high latency and packet-loss that would impact end users. Utilizing one of these lightweight sensors in virtual desktop environments allows proper tracking of the end-user digital experience.
We do have some deployment recommendations for Azure Virtual Desktops to improve the ICMP collection; however, Service Watch Active Testing will provide even more and deeper insight into the network performance via VoIP or bandwidth active tests. In our next blog, we’ll be covering the configuration options for collecting more and improved ICMP data through Service Watch Desktop for Azure Virtual Desktop, so make sure to stay tuned.