How to Choose the Right IT Ops Metrics
Moving Operations From On-Prem to the Cloud
Traditionally, we consider IT to be managing and monitoring on-premises network infrastructure, including hardware and software. However, the reality is that most enterprises have accepted and migrated much of their infrastructure to the cloud already. They recognize the benefits of the cloud and that it is here for the long haul.
According to the latest study from Deloitte, 90% of organizations have been using cloud services for the last three years, and 79% are hosting workloads with multiple cloud providers. In addition, adopting cloud computing platforms has accelerated significantly in the remote work era.
But once you migrate to cloud-based services, you lose many of the controls you had on-premises and are left with cloud visibility challenges. As a result, when end-users have problems accessing SaaS or cloud applications from their home network, the ITOps team struggles to troubleshoot and deliver an optimal digital experience.
A New Way to Look at IT Metrics
Today, when it comes to providing substantial value to an organization, modern ITOps is expected to deliver key results in areas such as
- Supporting a remote workforce
- Optimizing a great digital employee experience (DEX)
- Managing business costs and investments
- Implementing and monitoring technologies like UCaaS to boost collaboration
- Measuring overall response times and latencies from many vantage points, many networks
Identifying metrics for the above new initiatives and tying them to business outcomes is crucial for CIOs. Why? Because it builds their trust and confidence in the IT support model. Without any metric insights or key performance indicators (KPIs), operation teams waste valuable time and resources in diagnosing problems and not achieving desired outcomes.
Why are IT Operations Metrics Important
As discussed above, collecting metrics is part of a fact-based methodology to assess your company’s progress towards meeting business goals.
Gaining complete visibility into different SaaS apps, networks, and endpoint component performance is hard. But when network teams have several data points about an application’s health and performance using Digital Experience Monitoring, it tells a true story of how engaged your employees are.
Tracking relevant and meaningful IT metrics helps to
- Reorient technology objectives toward company priorities
- Improve decision-making for business leaders
- Communicate value through critical data points
- Monitor the health of all applications and digital experience
- Tackle opportunities to drive performance and agility
Ultimately, IT all comes together at the employee digital experience.
What IT Metrics to Track
There are several options for IT to track metrics. But sometimes, they can be too many of them. Furthermore, fatigue from alerts can be real, and without a “single pane of glass,” technology teams are often juggling tool sprawl issues.
Here, we present five metrics you can actively track and help your team be more efficient with their monitoring operations.
1. Service Availability

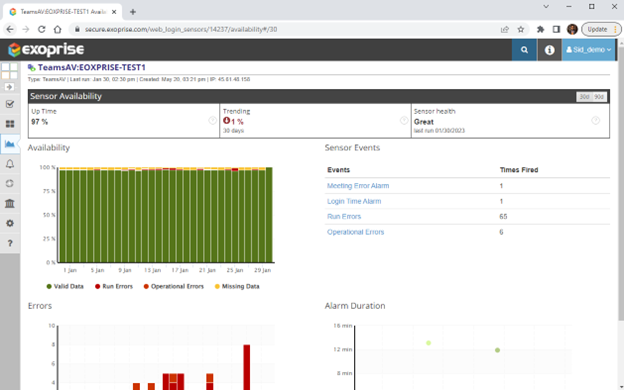
Use this report to ensure that SaaS vendors meet service level agreements (SLAs). The sensor availability data shows you the long-term health of any application service. Measure uptime, downtime, and any outage impact on end-user productivity. Recover costs or get credit when cloud providers violate uptime guarantees.
2. SaaS App Performance

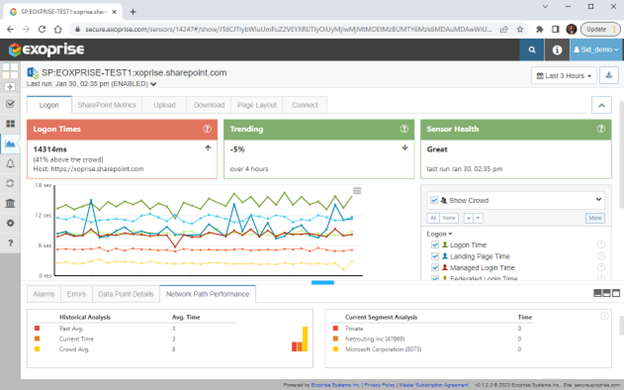
When end-users complain of a slow application URL, check the loading or rendering times for the individual site via connection time, TTFB, logon time, etc. Furthermore, compare a particular site’s performance to the crowd analytics to immediately rule out a localized problem. Reduce the mean-time-to-resolution (MTTR) by as much as 50% when a problem occurs.
3. Application Reliability & Performance

Are you running into Microsoft Teams, Zoom, or desktop client difficulties? Outlook/Exchange or OneDrive not operating correctly via the VPNs, cloud-based proxies (slow) or other technologies?
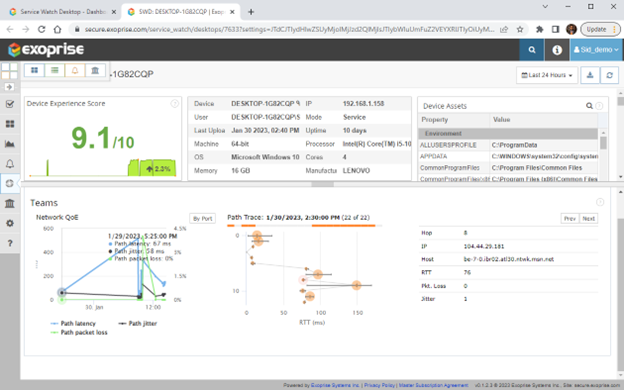
Get real-time Internet path and application response time visibility from a user network through their gateway, ISP, and backbone, to the service provider. Visualize packet loss, latency, and jitter at every network hop and find where the bottlenecks are. In a few clicks, diagnose whether the user issues (streaming or connectivity) are in the LAN/WAN, SDWAN, ISP or with the service provider’s data centers.
4. Endpoint (Desktop or Laptop) Performance

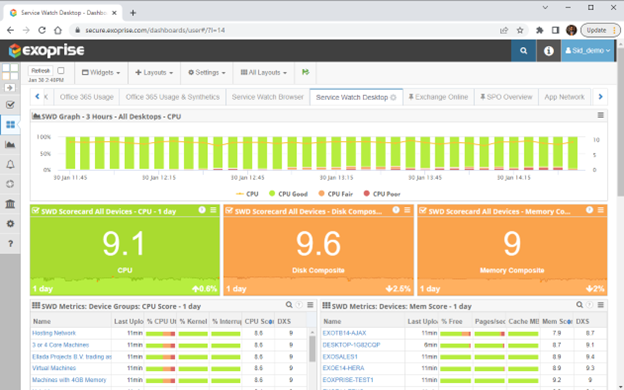
With all of us working from anywhere (WFA), you need to monitor endpoint performance from a remote employee’s perspective. Observe experience score trends, composite resource utilization, reliability and stability index, etc., to ensure success with networked applications and services. Drill down into individual user machines to understand what applications are causing grief and prioritize troubleshooting.
5. Production Incidents

Integration of your monitoring tool with ITSM (ServiceNow) means that all alerts and incident notifications are automatically and effortlessly captured in the help desk system. That way, you can track all incidents, severity levels and maintain event history.
Ideally, a proactive monitoring tool will detect all of these problems and alert right away, so IT teams can fix them quickly before employees themselves start creating numerous tickets.
Take Control of Your IT Operations
Monitoring your IT environment should be exciting and not challenging. That said, effective management of modern and complex systems requires tools beyond basic metrics alone.
Exoprise Digital Experience Monitoring solution easily tracks and reports all the above operational metrics via real-time and interactive dashboards. Metrics and alerts can be easily integrated with Power BI, Service Now, or any event management system via webhooks and other flexible technologies.
After obtaining additional context with real-user monitoring AND synthetic transaction monitoring, your team has complete visibility and coverage to diagnose faster and resolve any problem end-to-end.

