
How ITOps Uses Real-Time Monitoring for Easy Fixes

Here’s a scenario.
All your enterprise apps are running fine, as you expected. Maybe your team wasn’t impacted by the Microsoft 365 outage a couple of weeks ago. Good for you!
But don’t let past application performance predict current performance.
Instead, choose real-time monitoring to efficiently manage your network and proactively resolve app health issues at any time. That way, the IT operations (ITOps) team has visibility into your entire digital estate and pinpoint services unavailable to end-users.
What is Real-Time Monitoring?
Real-time monitoring collects performance metrics periodically as data moves through interconnected systems, networks, applications, and endpoint devices in your infrastructure.
The data collection happens at low latency and high frequency, so network administrators and the operations team can visualize problems immediately (& thoroughly) as they occur. And they need to be combined with proactive alerting and lots of contextual information.
When we talk about context and contextual information, we’re really talking about helping reduce Mean Time to Recover (or Mean Time To Restore) (MTTR). That is executed and accelerated through an integrated User Interface (UI) custom dashboards and continuously capturing as much contextual information as possible during an outage or perceived slowdown. Our UI presents numerous opportunities to quickly view historical behavior and drill down into specific services that require urgent attention. Or even our ever-present crowdsourced monitoring.
Businesses and Ops teams use real-user monitoring (RUM) to reveal and predict actual trends with application services.
Capture Data for Smooth IT Operations
When checking on the current performance of your IT environment or end-to-end SaaS services, the following real-time data on various digital assets in your ecosystem should be collected:
- Application response time, latency, jitter
- Network path performance, hop-by-hop detail for core applications
- System resource performance
- Overall network bandwidth and utilization
- Overall Wi-Fi performance, degradation and gateway round-trip-times
- Web transaction, connect, and login time
- Endpoint reliability and stability index
Reaping Real-time Monitoring Benefits
IT managers can glean all the insights generated by real-time monitoring to improve service quality and tweak their strategy on the go. Here’s a list of benefits of implementing such a system.
-
Makes monitoring proactive
Instead of a reactive approach to solving problems, real-time monitoring takes a proactive methodology to detect any outages and preempt future incidents. This process instills confidence in team members and makes the IT practice efficient.
-
Reduces MTTR
When an outage occurs on the provider’s end, ITOps can proactively choose an alternative tool or technology for the business. When the outage is pinpointed to the IT team’s digital estate, the time to resolve can be reduced, saving millions of dollars.
-
Reduces end-user complaints
The best thing about having a proactive system is that you get notified before your end users do. You can use this information to disseminate to all the employees and spend quality time diagnosing difficulties in your network than dealing with user complaints.
-
Lowers troubleshooting costs
When employees don’t complain, they don’t submit as many tickets. With a real-time monitoring system, your team can diagnose and troubleshoot problems in a few clicks. As a result, there is a lot of money to be saved in the IT world.
-
Increases employee productivity
By maximizing uptime, network, and technology teams ensure that employees are happy and productive. Of course, every network endures some form of downtime, but by finding issues quickly, you’ll be fixing them faster too.
-
Optimizes digital experience
Real-time monitoring quickly identifies network bottlenecks in the entire delivery chain when a remote worker complains about slow SaaS or desktop app services. What follows next is an optimized digital experience and improved application performance.
See How Microsoft 365 Has Been Performing
Subscribe to our weekly Cloud Health Report to see how Microsoft 365 performed last week. Measured anonymously from 1000's locations throughout the world - it's legit. See performance and availability trends of Microsoft 365.
How Exoprise Monitoring Help
Time is of the essence during troubleshooting.
Access to unified reporting and a consolidated view of your digital footprint (including those of your remote employees) enables IT analysts and CIOs to collaborate faster and share information internally.
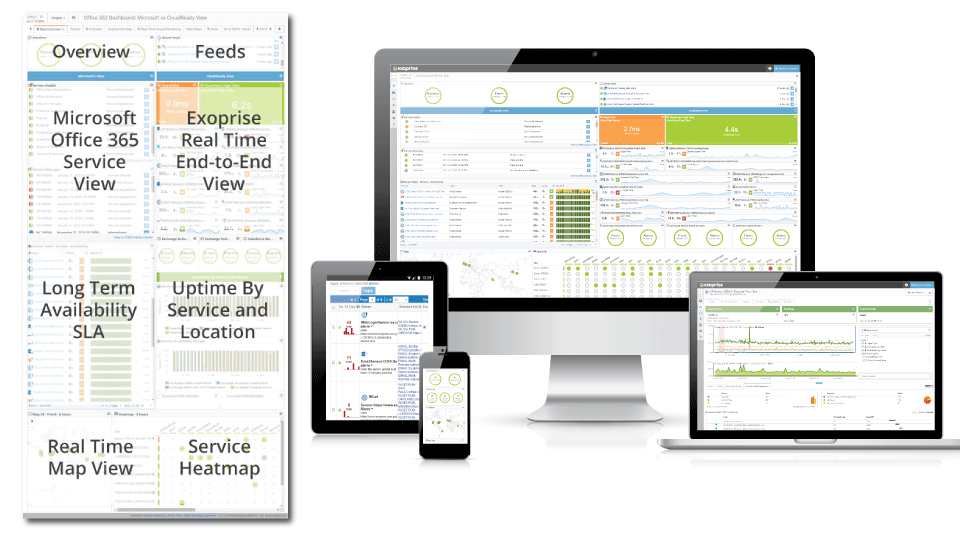
Exoprise displays relevant real-time monitoring data in custom or out-of-box dashboards with 100’s of reports in the form of charts, widgets, and graphs. While there are several ways you can use our dashboard, I am offering below four use cases requested the most by our customers.
Use Case #1 – 360 Degree View Into All Impacted Services
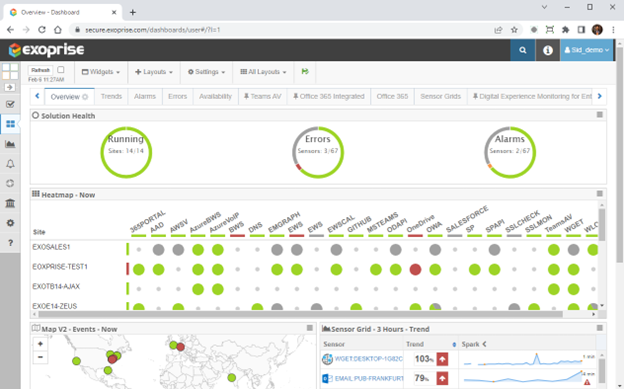
CloudReady synthetic transaction monitoring (STM) emulates real users accessing cloud services such as Microsoft 365, Salesforce, Azure, AWS, and any other SaaS app – from the cloud or behind a firewall. After deployment, the sensors are 24×7 monitoring the health and availability of all configured services in real time via web UI, client, or API transactions.
The “Overview” dashboard above summarizes the number of error notifications, alarms, and successfully running applications. In addition, there is a heatmap view of services across multiple locations impacted in red and others in green. IT admins can also notice the geographic regions where users may have trouble accessing some apps.
Use Case #2 – Comprehensive Active Monitoring for ALL of Office 365
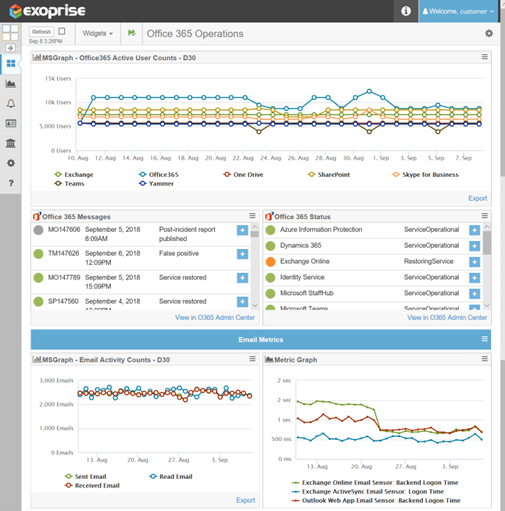
Even though CloudReady offers you three built-in layouts for monitoring ALL of Office 365, you can customize them further with a simple drag and drop for your reporting needs. Exoprise integrated Microsoft 365 dashboard combines O365 usage, operation, and activity data along with end-to-end monitoring and SLA measurements in one place.
No other vendor provides deeper and wider coverage of Office 365 performance than us.
Furthermore, the monitoring tool leverages open APIs to pull Office 365 data related to service updates, status messages, and real-time notifications, so your team remains abreast of new developments.
Use Case #3 – Identify Slow Pages of a Domain (Salesforce)

Along with synthetics, you should incorporate RUM into your real-time monitoring strategy. That will help IT operation teams measure digital employee experience for web apps like Salesforce.
No matter where you work, a seamless network connection and an optimal CRM performance are vital to driving sales growth and closing business opportunities. But all that takes a hit when Salesforce is slow, and your team can’t engage with prospective buyers in time.
Exoprise Service Watch Browser is the perfect and secure plugin extension to monitor the performance of any domain URL page. Get all the network path diagnostics to troubleshoot issues with slow SaaS providers, proxies, ISP, SSO, gateway, and home Wi-Fi affecting page response times.
Use Case #4 – Troubleshoot Dropped Calls, or Poor Microsoft Teams Call Quality
Our blog’s last and final use case is about optimizing the call quality and digital experience for Microsoft Teams. As a UCaaS application, Teams is widely used for conference calls and video meetings to boost collaboration and complete daily projects.
But occasionally, your employees will encounter choppy Teams video or see the message “your network is causing poor call quality” during audio, video, or screen share. The most likely cause for Microsoft Teams’ poor call quality is packet loss.
Packet loss occurs when a network is busy (bandwidth constraints), equipment fails, or due to poor Wi-Fi signals.
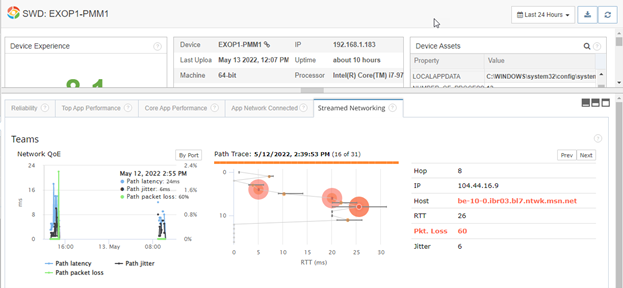
Troubleshooting Teams problems for a user can be a challenge for IT, but not with Exoprise Service Watch Desktop.
The endpoint monitoring tool effortlessly captures streaming performance metrics such as packet loss, jitter, and response time in real-time to pinpoint where the difficulties are along the network hops. You can view all this information in the Service Watch streamed networking canonical dashboard.
One Tool for Your Real-Time Monitoring Needs
At any time, ITOps usually has several tools to manage, but all you need is a single tool for complete visibility of app performance and underlying dependencies.
Don’t make it cumbersome to monitor the health of all services, identify problems and isolate the root cause.
Use RUM + Robots™ as your monitoring foundation to get immediate results for your org and improve your experience with impacted services.